在临床医学上,眼科医生依据眼底疾病患者的眼底彩照图像进行详细的筛查与诊断并给出具体的治疗方案。然而,由于每位眼科医生的临床诊断经验存在差异,这将会严重影响人工诊断的效率与效果。甚至,有些地域受限于当地医疗资源,病理性高度近视患者无法得到及时的诊疗,容易造成不可挽回的人眼视力损伤和失明。因此,近年有越来越多的数据集被公开,以期望MIA社区能运用数字图像处理、计算机视觉以及深度学习等领域的方法,致力于对患者的眼底彩照图像进行精确的处理和实现疾病的自动诊断。
1. 眼底结构简介
目前,眼底检查主要通过医生利用检眼镜、眼底荧光造影、眼底相机成像以及光学相干层成像等方式来进行人工检查。利用眼底相机采集到的眼底彩照图像会呈现视网膜上主要组织结构,如图1所示。由图1可知在眼底彩照图像中,血管(Vessel)在视网膜上分布最广且呈现为暗红色的网状结构,其和视觉神经纤维从视神经盘(Optic Disc)区域进入视网膜(Retina)。从图中可见,视神经盘通常呈现为边界较为清晰、亮度较高的圆盘状结构。此外,眼底图像中部颜色较深的区域称为黄斑区(Macula Lutea),黄斑区呈椭圆形凹陷,其凹陷的中心称为中央凹(Fovea)。中央凹是人眼视力最为敏感的区域,一旦该区域发生病变,视力将受到严重影响。
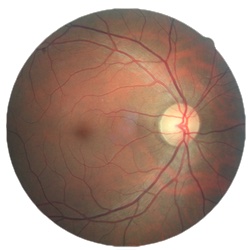
图1 眼底彩照图像
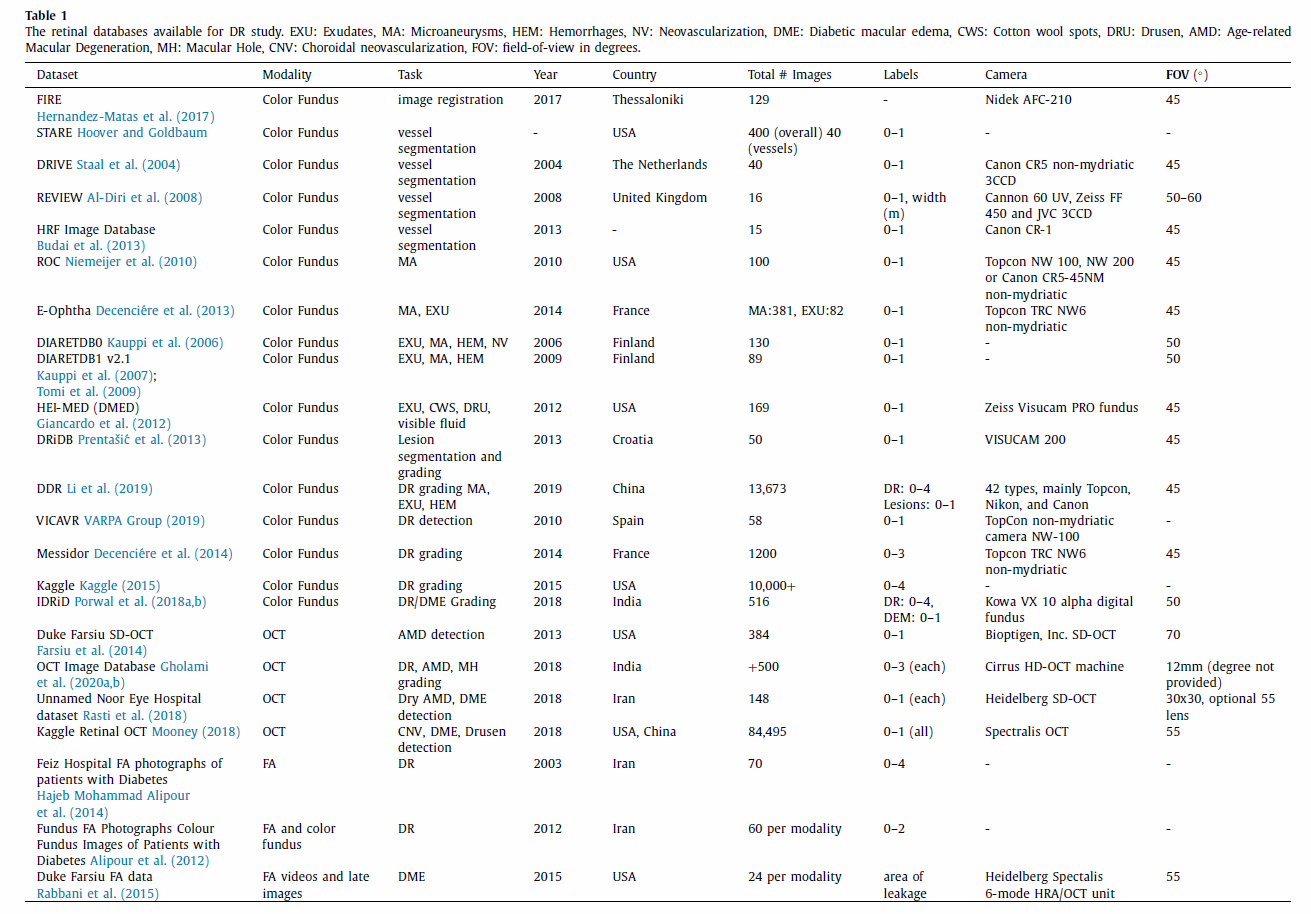
2. 多模态数据集简介
FIRE
Fundus Image Registration (FIRE) - includes 129 fundus images and a total of 134 image pairs. These data form three subsets according to visual characteristics. The files contain the image pairs and the corresponding ground truth, a binary color region of interest (ROI) mask, and a features ROI mask.
STARE
Structured Analysis of the Retina (STARE) - download all 400 raw images or in sets of 100. The corresponding diagnoses can be accessed separately in a.txt file. Another zip file contains the annotations for all images as text files; these include extensive lesion and regional features. The blood vessel segmentations include 40 hand-labeled vessel maps. 80 images detail optic nerve head detection and ground truth. The overall dataset offers a wide variety of disease and lesion types; however, the annotation system is slightly complicated. In comparison, the blood vessel segmentation gives more precise vessel detections.
DRIVE
Digital Retinal Images for Vessel Extraction (DRIVE) - contains 40 images wherein 33 are normal and 7 are diseased. Experts labeled pixels across all 40 images for vessels. The 20-image training set has a single golden standard segmentation, whereas the 20-image test set has one golden standard segmentation and one independent segmentation. Researchers must join the DRIVE challenge to download the data.
REVIEW
Retinal Vessel Image set for Estimation of Widths (REVIEW) - contains 16 images with 193 vessel segments. The dataset holds four image subsets: high-resolution, vascular disease, central light reflex, and kick-points. These subsets reflect different disease types and segmentation challenges.
HRF
High-Resolution Fundus (HRF) Image Database - organizes fundus images by patient condition; it contains 15 healthy, 15 DR, and 15 glaucoma. Binary vessel segmentation maps accompany these images and serve as the golden truth segmentations.
ROC
Retinopathy Online Challenge (ROC) challenge - this dataset focuses on detecting MAs and dot HEMs in a 100-image set. The competing teams had the ground truths for the 50-image training set and were masked to the ground truths for the 50-image test set. This challenge reoccurs annually for interested parties; otherwise, inquirers can register to download the data for separate research use.
MAs
E-ophtha - contains two subsets: e-ophtha-MA (MAs), and e-ophtha-EX (EXudates). Researchers must complete a download request form to obtain the data. Each database contains patient-wise folders that include fundus images and binary lesion masks (ground truths). The exudate set holds 47 images with exudates and 35 without. The MA set holds 148 images with MAs or small HEMs and 233 without.
DIARETDB0
130 fundus images with 20 normal images and 110 with signs of DR. The database contains subfolders for an evaluation script, evaluation results, html versions of the images, the base images, test data, and train data. The base image folder contains the binary image masks, fundus images, ground truths, and example images. The groundtruths are Microsoft files with the contained lesion or vessel types noted. The train and test datasets contain nine text files each that identify images that fall within the respective sets.
DIARETDB1 V2.1
89 fundus images with 5 normal images and 84 with signs of DR. The primary data folder contains all fundus images, the fundus binary mask, and a ground truth folder. The ground truth folder contains separate folders for hard exudates, HEMs, red small dots, and soft exudates. These folders contain lesion maps for all images that contain the respective lesions.
HEI-MED
Hamilton Eye Institute Macular Edema Dataset (HEI-MED) - consists of 169 fundus images that have been processed for exudates and DME. The database holds the base images, groundtruth text files, image metadata, vessel segmentations, and the ELVD quality metric.
DRiDB
Contains 50 images that are graded for DR, DR lesions, normal retinal structure, and neovascularizations. The groundtruth files are image annotations accompanying the base retinal images. Researchers must email the original investigators for download.
DDR
Contains 13,673 fundus images with image annotations for DR grading and lesion segmentations. 757 images also have corresponding ground truth images for pixel and bounding-box annotations. The data are broken up into 10 zip file subsets.
VICAVR
Includes 58 fundus images which are marked for vessel caliber and type. Investigators email the original study team for use.
MESSIDOR
1200 fundus images divided into sets of 400. Each set is divided into 4 100-image subsets with corresponding excel files matching diagnoses. The images are graded for DR from 0 to 3 according to presence and quantity of MAs, HEMs, and microvascularization. The DME grade is from 0 to 3 according to presence of hard exudates and their distance(s) from the macula. 800 images captured dilated eyes, 400 undilated eyes.
Kaggle DR detection
Contains over 10,000 fundus images from EyePacs. A clinician rated each image for DR on a scale from 0 to 4. These images vary by camera, eye polarity (left/right), inversion or view, and noise like artifacts and exposure issues. Since the dataset is large at 82GB, the training and test files are each divided into smaller subsets. A.csv file lists the training labels.
IDRiD
Contains 516 fundus images that have been graded for DR and DME. Experts annotated pixels for lesions in 81 of the images. These binary lesion maps are also available. The entire dataset is graded for DR and DME according to the International Clinical DR Scale and the presence of hard exudates near the macula, respectively. The grountruths are provided in a.csv file. Locations for the OD and fovea center are also in a separate.csv file.
Duke Farsiu SD-OCT dataset
Compiles 384 SD-OCT images from Age-related Macular Degeneration (AMD) (269) and control (115) subjects. The data is over 20GB in size; thus, it is accessible in MATLAB format and divided into data subsets for easier use. Overall this data includes over 38,400 B-scans, all subject ages, and the ground truth segmentation boundaries.
OCTID
OCT Image Database (OCTID) - contains 500 images that are divided into five categories: normal (206), Macular Hole (102), AMD (55), Central Serous Retinopathy (30), and DR (107). The data and corresponding ground truth segmentations are available as JPEG images in zip files.
Noor Eye Hospital dataset
Includes 148 images that are divided into 50 normal, 48 dry AMD, and 50 Diabetic Macular Edema (DME). OCT images contain different resolutions and numbers of A-scans across patients. The ground truth segmentations accompany the scans.
Kaggle retinal OCT images
Contains 84,495 images that are graded as normal, choroidal neovascularization (CNV), DME, or drusen. The dataset first divides the images into training, testing, and validation; then, they are further divided by disease type.
FA
Isafahan Feiz hospital fluorescein angiography (FA) images - includes 70 images of patients. The database includes DR grades and ground truth images for segmentation of the foveal avascular zone.
Combined FA / color fundus images
Combined FA / color fundus images - includes 70 images from each modality and are classified into three DR severity levels (normal, mild/moderate NPDR, severe NPDR and PDR).
Duke Farsiu FA video and images
Duke Farsiu FA video and images - contains videos and late still-frame images from 24 subjects with DME. The data is divided into one shared folder for base videos/images and another for the ground truth leakage segmentations.
3. 几种典型的图像模态
3.1. Single-field imaging
3.1.1. General single-field imaging
Single-field fundus images capture the optic nerve and macula under 20–50 degrees of FOV. Use of this method relies on the assumption that they capture the most prevalent pathologies, but this method risks missing important fundus lesions within the periphery (Witmer and Kiss, 2013). Traditional systems rely on single-field montages, with seven standard 30-degree images from the Early Treatment Diabetic Retinopathy Study (ETDRS) representing the standard for DR detection since 1991 (ETDRS Research Group, 1991). Montage images show results in DR detection and classification, but collection relies on skilled procedures that are inconvenient and time-consuming in practice.
3.1.2. Mobile screening systems
Despite increasing rates of DR globally, financial and practical resources impair access to treatment in developing areas (Sengupta et al., 2019). Lower income areas often lack proper ophthalmic resources for active screening, therein individuals often miss adequate follow-up due to financial and travel restrictions. A portable fundus camera could mitigate this health barrier by providing a mobile screening system at low cost. Ideally, these devices would deliver high-quality images that are comparable to results using tabletop systems in terms of gradability and alignment. The Remidio Fundus on Phone (FOP) represents a current implementation that delivers smartphone-based results with a 45-degree FOV, three fields, and mydriatic or non-mydriatic modes. Further, the system offers a HIPAA-compliant, cloud-based storage system for off-site clinical viewing and ophthalmic evaluation. However, FOP still poses challenges concerning user variability and limited FOV as compared to current standards in DR screening and treatment. Thus, current studies integrate systems like FOP with web-based deep learning systems to offset user variability, specialist availability, and limitations in FOV and gradability.
3.2. Wide-field imaging
Wide-field imaging (WFI) presents important information regarding disease manifestations in the peripheral retina (Falavarjani et al., 2017). The advent of modern technologies allows field-of-view (FOV) up to 200-degrees, therefore facilitating significant advance in retinal imaging. WFI modalities include WF color imaging, autofluorescence, fluorescein angiography, and indocyanine green angiography.
WFI refer to systems with FOV capabilities above 30-degrees, based on historical standards. FOV denotes the external angle of the light source hitting the eyea cameras FOV depends directly on lens power and indirectly on focal length. Using a confocal scanning laser ophthalmoscope, the Optos camera offers large scan angles and separable green and red laser light components (for focus on specific structures). The Optos system maximally allows a 200-degree FOV, representing eighty-two percent of the retinal surface. Despite its many advantages, the Optos system carries some limitations pertaining to ora-to-ora capabilities, imaging of anterior pathologies to the equator in all quadrants, distortion and decreased resolution of peripheral images on the two-dimensional scale, and artifacts created by anterior objects. However, current equipment addresses these issues, including combining steered-ultra field images for full retinal viewing and stereographic projection software for combat of image warp.
Retcam imaging systems maximally provide a 130-degree FOV (Witmer and Kiss, 2013). It consists of a portable camera system that it lit by a fiberoptic cable. Such systems yield high use with younger patients. Spectalis represents a noncontact ultra-wide-field system with a maximum 102-degree FOV.
Ultra-wide field (UWF) images present higher detection of severe non-PDR and PDR than in clinical study, with higher level classification than in ETDRS fields in ten percent of eyes. Non-mydriatic Optos UWF color images yield high agreement to mydriatic UWF color images. Further, predominantly peripheral lesions appear outside of standard ETDRS fields in over fifty percent of cases; hence lesion types that help detect DR may go undetectedthese lesions include microaneurysms (MAs), hemorrhages, venous beading, and microvascular abnormalities.
3.2.1. Fluorescein angiography
Fluorescein angiography provides ultra-wide field potential; it offers advantages surrounding diseases which require tracking and detection of peripheral neovascularization, vessel development, and/or obliterative vasculitis (Falavarjani et al., 2017).
WFI initially was applied in DR screening, later Friberg proposed WF studies to predict PDR by correlating peripheral capillary nonperfusion to neovascularization (NV). Fluorescein angiography shows high potential concerning detection of microaneurysms (MAs) AND NV, to screen for initial or mild DR and PDR respectively. Ultra-wide field imaging provides 3.2 times the retinal surface coverage compared to convention seven standard fields; thus, ultra-wide-field angiography provides changes indicative of PDR with higher accuracy, including peripheral vessel leakage (PVL), NV, peripheral nonperfusion, and macular edema. Wide-field angiography facilitates superior treatment of PDR as well, via targeted laser photocoagulation.
3.2.2. Auto-fluorescent imaging
In auto-fluorescent imaging, 532nm (green) light excites particles and the emitted signal is detected in the 570-780nm range using a raster scan and detector (Falavarjani et al., 2017). The technology scans the eye for fluorophores, which fluoresce when exposed to specific wavelengths of light. Auto-fluorescent imaging differs from fluorescein angiography, as the former records fluorescence that occurs in the eye naturally or as a by-product of disease. Natural fluorescence occurs due to optic nerve drusen, astrocytic hamartomas, lipofuscin pigments, and the aging crystalline lens. Since this imaging modality measures natural fluorescence, it does not require dye injection.
Auto-fluorescent imaging primarily centers on lipofuscin deposited in the retinal pigment epithelium (RPE). Structures like the optic nerve, retinal blood vessels, and the fovea appear dark compared to the RPE (and thus easily visualized). This is due to the absence of RPE, blocking of RPE fluorescence, or absorption of the excitation wavelengths, respectively.
3.3. Optical coherence tomography (OCT)
3.3.1. General OCT
Optical Coherence Topography (OCT) facilitates noninvasive examination for diabetic retinopathy with high accuracy, such that patients can be treated before irreversible vision loss (Cheung and Wong, 2018). OCT applies low-coherence interferometry to produce two-dimensional images of optical scattering from tissue microstructures (Huang et al., 1991). It resolves structures with spatial resolutions within a micrometer range, thus detecting signals that are significantly smaller than the incident optical power. Specifically, this method measures cross-sections of tissues by applying low-coherence light and measuring the resulting reflections off tissue surfaces. Low-coherence reflectometry uses time-of-flight delay from reflection boundaries and backscattering sites to determine the longitudinal location of these sites. Multiple longitudinal scans are captured at lateral locations. OCT shows superior optical sectioning capabilities that are not limited by depth or spatial resolutions.
3.3.2. OCT-angiography (OCTA)
OCTA offers a noninvasive alternative to fluorescein angiography and has gathered substantial interest concerning detection of DR (Cheung and Wong, 2018). Recent trials have focused on advanced stages of DR, including leading causes of blindness such as the following: severe non-proliferative DR, PDR, diabetic macular edema (DME), and diabetic macular ischemia (DMI) without DME. In comparison to fluorescein angiography, which particularly captures changes in the superficial capillary plexus, OCTA independently captures three capillary plexuses: superficial, intermediate, and deep. Numerous OCTA metrics, such as foveal avascular zone (FAZ) size and vessel density in the different plexus (i.e deep), may influence DR severity and patient visual acuity. Therefore, many OCTA metrics may prove useful in detection and monitoring of DR. However, studies must first establish parameters to normalize these metrics such as to limit the interference of other factors like age, comorbidities, and duration of diabetes.
4. 汇总
具体的数据链接请参考A survey on medical image analysis in diabetic retinopathy